About
Mission and Vision
Equip. Energize. Elevate.
“. . . The purpose of a Gustavus education is to help its students attain their full potential as persons, to develop in them a capacity and passion for lifelong learning, and to prepare them for fulfilling lives of leadership and service in society.” - The Gustavus Mission Statement
“Gustavus equips students to lead purposeful lives and to act on the great challenges of our time through an innovative liberal arts education of recognized excellence.” - The Gustavus Acts Vision Statement


Progress. Innovation. Promise.
Our campus is energized by the power of progress. We are moving forward together. New scholarships, top-notch faculty, and a growing endowment all support our belief that critical thinking and world perspective are essential skills. Gustavus is committed to meeting the financial need of all admitted students and to providing world-class, state-of-the-art resources and facilities.
Values
Core Values
As a Gustie you don’t get to pick and choose which core value you’d like to follow. Instead, you are challenged to manifest them all in your daily life. EXCELLENCE is connected to COMMUNITY is connected to JUSTICE is connected to SERVICE is connected to FAITH. Everything is connected to learning and academics. The core values ebb and flow through your years at Gustavus, and that combined experience results in how you’ve made your life count as a unique and exceptional singular Gustie.
-

EXCELLENCE
Decide what excellence means to you. The Gustavus community values that unique decision, and then works with you to help you lead a purposeful life and to act upon the great challenges of our time. Setbacks and failure are part of progress. It’s through mistakes that we learn how to learn. We are here to equip you with the necessary skills to grow through questioning, decision-making, and action. Gusties take their innovative liberal arts education into the world to make it a better place, too.
-
COMMUNITY
Gusties understand true success isn’t found in the I, but in the we. We are a campus community, a Minnesota community, a national community, and a global community. But most importantly, we are a community of compassionate individuals—students, faculty, staff, and alumni—who care about and support each other. The Gustie Spirit fills the campus with joy and energy. We think together, work together, and play together. Our individual critical thinking and combined perspectives build holistic success for us and others. The challenge is to become the best, most well-rounded person you can be—together.
-
JUSTICE
At Gustavus we work toward justice by identifying the wrongs in our communities and working to address them. Gustavus believes in equity. Race, class, gender, sexual orientation, and religious beliefs all need voices to speak to the truth of discrimination. Gustavus has a long history of social justice and is working to think and act more deeply in this regard. You make your life count when you see injustices and take action to make change, big and small.
-

SERVICE
Service is composed of forward movement, acts, and advocacy that help fellow Gusties, your neighbors, or strangers achieve success or solace or happiness or comfort for a moment, day, week, month, or lifetime. Service is rooted in action. Whether you pick up trash or tackle the complicated issue of homelessness, it’s action that defines us. Service can’t exist without people pulling together to understand the complicated world in which they live. Service offers an opportunity to carry your holistic liberal arts learning outside of the classroom and into the world outside your door.
-
FAITH
The college’s Lutheran heritage has deep roots in acceptance and openness. The Lutheran tradition insists upon freedom of inquiry and criticism in the pursuit of knowledge and truth. This combination of intellectual rigor and a complex understanding of faith unites liberal arts principles on campus. Gustavus actively embraces all religious beliefs. Through a spiritual higher power, Gusties seek to better know and understand the earthly and spiritual world around them, and through the inherent compassion that is grounded in Lutheran beliefs, they work to help others benefit in the larger community. Gusties are grounded in faith, open to the world.
Just the Facts
Learning Everywhere
LIVE + LEARN
Students learn both inside and outside the classroom. Faculty are dedicated to undergraduate teaching in 73 majors ranging from Scandinavian Studies to physics and exercise physiology to geography.
Learn more about academics at Gustavus
On our residential campus, students have the opportunity to take part in competitive NCAA Division III athletics, create beautiful music and visual art regardless of your major, and dive deeply into student organizations devoted to a wide variety of causes and activities.

Gustavus Adolphus College is accredited by the Higher Learning Commission (HLC), the Commission on Accreditation of Athletic Training Education (CAATE), and the Commission on Collegiate Nursing Education (CCNE).
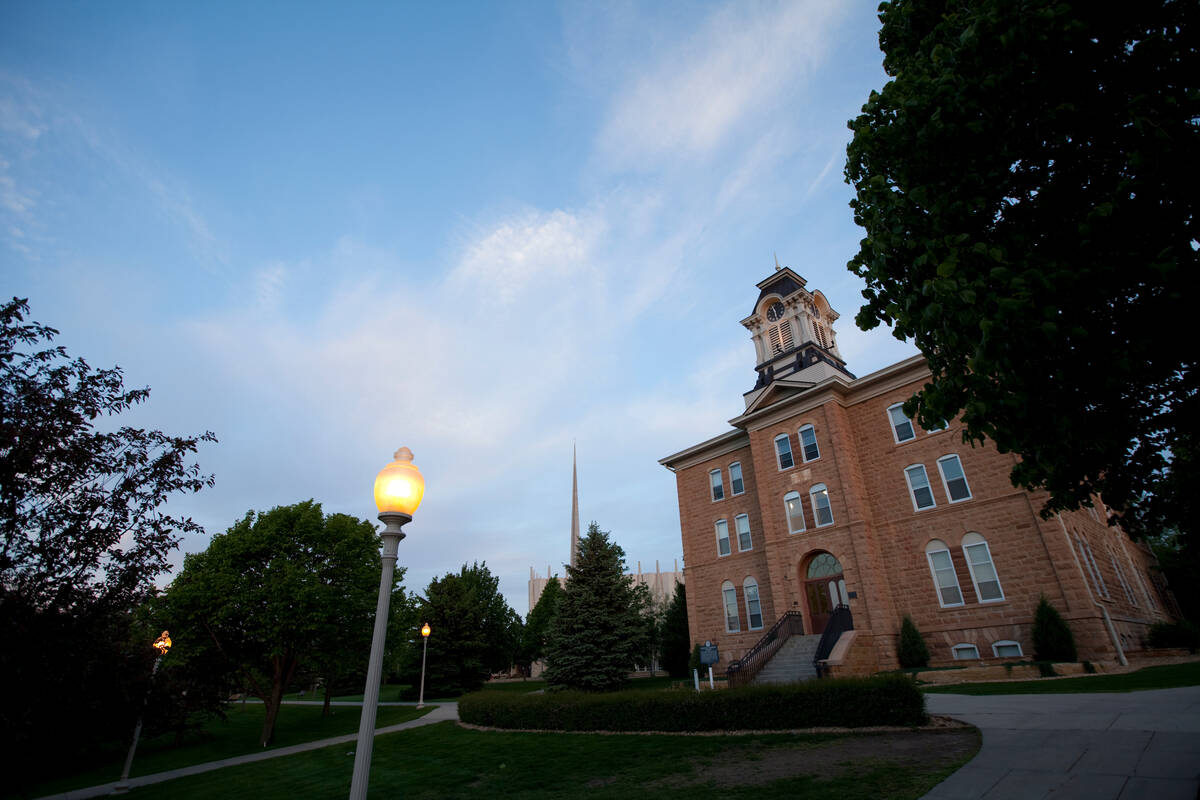
Location
Saint Peter, Minnesota
Located in the scenic Minnesota River valley town of Saint Peter and with easy access to Minneapolis-St. Paul, Gustavus offers the best of both worlds—community living in a safe and supportive campus environment and connections with Minnesota’s thriving network of employers.