Working together with an assigned partner (or in one group of three), you will gather data on how TCP's performance varies as a function of the per-packet delay and loss rate between the endpoints. You will do this by repeatedly timing a real FTP download into which you artificially introduce varying amounts of delay and loss. You will also analyze your results, describing the trends you see in the data and some of the factors that may account for those trends.
Each team will use two computers I will provide that are running the Ubuntu distribution of Linux. (Each computer can be logged in under the mcs account using the password 377.) The two computers will not be connected to the campus network (or any other external network) during your data collection. Instead, you will use an Ethernet cable to connect the two of them together as a very small local network with 100 Mbit/second transmission rate, sub-millisecond packet delay, and ordinarily zero packet loss. (You will use artificial means to increase the delay and loss.)
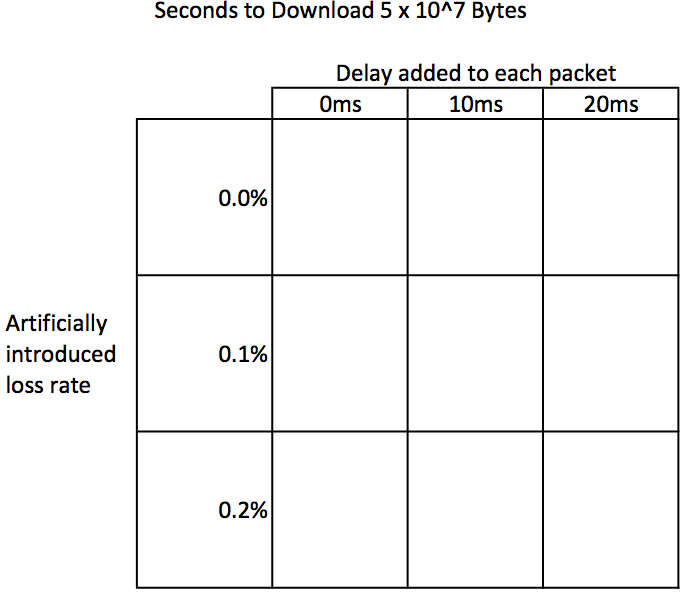
One computer ("computer A") will run a free FTP server called vsftpd and the other computer ("computer B") will run the standard FTP client program, which is simply called "ftp". Your team will create a file on computer A of size 5 × 107 bytes and download that file to computer B 45 times, each time recording the number of seconds that the ftp client reports were needed for the download. The 45 trials result from 5 repetitions in each of 9 different experimental conditions. The 9 conditions result from crossing 3 choices for added packet delay (0ms, 10ms, 20ms) with 3 choices for artificial packet loss (0%, 0.1%, 0.2%). In other words, you will be filling 5 values into each of the 9 cells of this table:
However, you will not fill all 5 values into one cell, then move onto the next. That could yield misleading data if one of the computers happened to be busy doing some background processing just when you were working on one of the cells. Instead, you will run the 45 trials in a randomized order so as to avoid any systematic bias. I generated a different randomized order for each team by running a small Python program:
I will bring to the lab a hardcopy of each team's randomized order so that you can mark off your progression through the order, as well as a hardcopy of the data table so that you can record your data in that more visually understandable format. (Later, in order to submit your data for grading and for me to pool together with the other teams, I'll ask you to type it into an Excel spreadsheet.)
On computer A, run the following four commands in a terminal window in order to install vsftpd, create a file of size 5 × 107 bytes, switch to Reno congestion control, and enable the network emulation software that you will use to add delay and loss:
sudo apt-get install vsftpd
truncate -s 50MB fiftymeg
sudo sh -c 'echo reno > /proc/sys/net/ipv4/tcp_congestion_control'
sudo tc qdisc add dev eth0 root netem
On each of the two computers:
Disable the wireless network.
Edit the configuration for the wired network so that IPv4 is "link local only".
Plug in the Ethernet cable.
Wait until the display shows that the wired network is connected.
In a terminal window, run the ifconfig command to verify the computer now has an IP address of the form 169.254.x.x. You will need this address for computer A.
On computer B run the ftp command in a terminal window, specifying computer A's address on the command line. That is, your command will be of this form:
ftp 169.254.x.x
Assuming successful connection, the ftp client will now prompt you for a username, offering you the default of mcs, the same username as you are logged in as on computer B. You can accept that default by pressing the Enter key. Then enter the password 377.
I am assuming you will do the remainder of the data collection in rapid enough succession that your FTP connection will not timeout. If it does timeout, you can quit out of ftp and restart it.
Now you will do the following for each of the 45 experimental runs listed in your randomized ordering.
If the experimental run involves an Xms delay and Y% loss, in computer A's terminal window, fill those two values into the following command:
sudo tc qdisc change dev eth0 root netem delay Xms loss Y%
Note that you only need to type this command in full the first time. Thereafter, you should use the arrow keys to bring the previous command back and edit it with the next values for X and Y.
On computer B, in the terminal window that is running the ftp client, give the command
get fiftymeg
After the first time, you can do this by pressing the up-arrow and Enter keys.
When the download completes, record the time in seconds in the appropriate cell of the data table and mark the experimental run off on your list, so that you don't lose your place.
Look through the data in your table and come up with some observations about it. Can you say anything about the variability of the five values within each cell? Do the differences from one cell to the next fit into any general trends, either reading across a row or down a column? If there is a general trend reading across the columns of a row, does that same trend fit all three rows, or do the rows differ? If there is a general trend reading down a column, does that same trend fit all three columns, or do the columns differ? How about if you move both across and down—do the horizontal and vertical effects combine proportionately, or is there some extra positive or negative interaction between them?
Given the size of the file and the fastest time of all your downloads, calculate what the bits per second was.
One of the factors that might lead you to an achieved speed less than 100 Mbit/s is that the Ethernet can't possibly spend all its time transmitting just data bits. The data is chopped up into segments typically of 1448 bytes. Each segment is typically augmented with 32 bytes of TCP header (the basic 20 bytes plus 12 of options), 20 bytes of IP header, and 26 bytes of Ethernet (link-layer) header and trailer. Moreover, Ethernet requires a gap of silence between each frame and the next, which is of the same duration as 12 bytes of data.
Taking these items into account, calculate what fraction of the Ethernet's theoretical 100 Mbit/s rate is actually available for he data contained in the segments, as opposed to being used for the various overhead items (headers, trailer, gap). How does this calculated data rate compare with what you measured in the best case?
Several factors could explain why some of your downloads took longer than the best-case time. Later, I'll show you how we can use Wireshark to look in detail at individual TCP segments for evidence of each of these phenomena. However, for now, I'd like you to think about how much of the download times you measured could plausibly be accounted for by each of the following factors. For each one, think about the circumstances they would occur under and the size of slow-downs they would cause. For each one, write a bit about where, if at all, you think they might be showing up in your measurements, and to what extent. Be sure to explain your reasoning.
Some TCP segments may be transmitted more than once. Since each segment takes some time to transmit, this would result in an increased time, just as though the file being downloaded were longer.
Sometimes, the sender might have to wait until the timeout timer expires before retransmitting a segment. This could result in periods of silence with no data being transmitted. (Your textbook mentions a minimum timeout interval of 1 second, but Linux actually uses 200ms.)
During the slow-start phase of TCP transmission, less than a full RTT worth of data transmission happens during each RTT of elapsed time until a high enough congestion window is reached. (That is, the transmission may pause until acknowledgment comes back, once the current maximum amount of unacknowledged data has been transmitted.)
During the congestion-avoidance phase of TCP transmission, less than a full RTT worth of data transmission happens during each RTT of elapsed time until a high enough congestion window is reached. (That is, the transmission may pause until acknowledgment comes back, once the current maximum amount of unacknowledged data has been transmitted.)
Having completed this experiment, one might extend it in any of various ways. One could try other delays or loss rates. One could download a much larger or smaller file. One could arrange that the random packet losses are not distributed uniformly, but rather correlate into clumps. One could arrange that the transmission rate is artificially slowed to less than the hardware's 100 Mbit/s. If you were to do any one extension (whether one I've listed or another you think of), which would it be? To earn the extra-credit point, you don't have to do the extended experiment, but you need to write an explanation of why you would make your particular choice.
One partner from each team should upload to Moodle your filled-in Excel spreadsheet of data and a document written in college-level English that describes the data, analyzes the best-case time, and evaluates potential causes for the observed slow-downs. If you chose to do the extra credit portion, your document should include that as well. See above for my expectations in each of these areas.