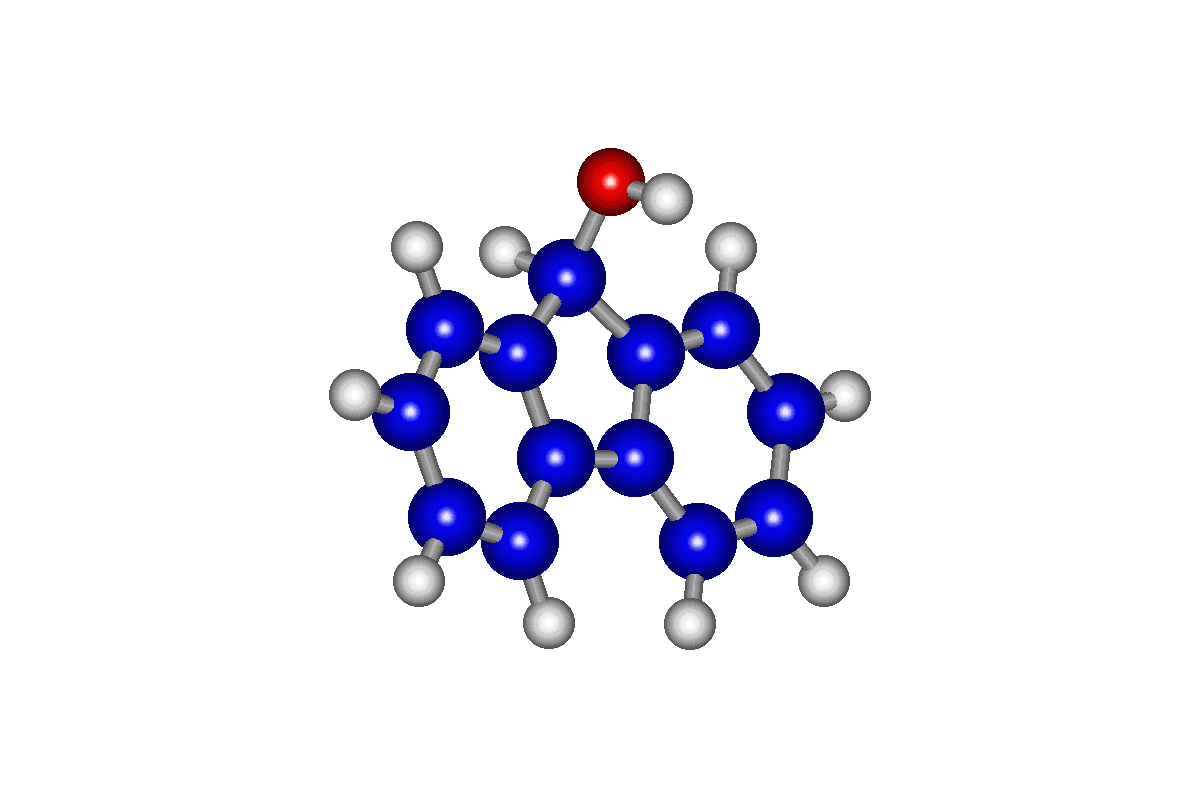
9-fluorenol


Spectroscopic and computational studies of 9-fluorenol and its vibrational modes were undertaken to investigate the potential to predict spectroscopic behavior of biaryl compounds through ab initio computations. Previous studies have been done on biphenyl, 9,10-dihydrophenanthrene and other conjugated systems. The goal of this study is to understand how the vibrational modes and electronic excitation affect the geometries and spectra of the ground, excited and ionic states of 9-Fluorenol.
Electronic spectroscopy, including ZEKE and resonance enhanced multiphoton ionization spectroscopy, were performed on gas phase 9-fluorenol in the molecular beam. Ab initio computations at the Hartree-Fock 3-21G and 6-31G* levels were performed using Gaussian 94, Windows and UNIX versions. Franck-Condon analyses, using the normal mode output from the computations, were performed to model the spectra nd predict the geometry of the S1 and ion ground states.
The 3-21G computations proved to be inadequate in optimizing the geometry and analyzing the normal modes of the molecule. Using the 6-31G* geometries and normal mode analyses, a difference of 0.1078 in the normal coordinate was shown to descirb the shift in the potential of the ground and S1 state. The difference between the excited state and the ground state ion was determined to be 0.1975 in the normal coordinate.
The spectroscopy experiments were performed by members of the Joe Knee group at Wesleyan University in Middletown, Connecticut.
The frequency output from Gaussian 94 provides displacements of the individual atoms in a given normal mode of the molecule. To convert the output displacements to the appropriate normal coordinates, those produced by HyperChem 5.0 , the following mathematical algorithm can be applied.

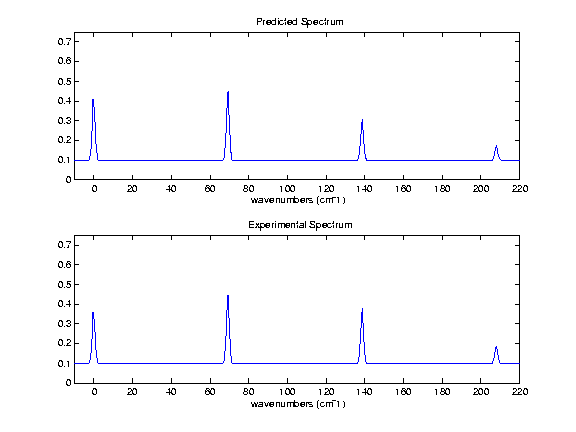
Figure 1. The 6-31g normal mode analysis allowed us to replicate the experimental excitation spectrum of the ground state of 9-fluorenol. The first peak is the excitation of an electron from the vibrationless level in the ground state to the vibrationless level in the S1 state. The top spectrum above was created using a Matlab 5.0 Student Edition script file. The bottom spectra is a replicate of the relevant portion of the experimental spectrum.

Figure 2. ZEKE spectroscopy was used to create the bottom spectra, and a difference of 0.1975 was used to replicate the experimental spectra. The normal mode analysis was again performed at an HF 6-31G* level. This spectra shows transitions from the origin of the S1 to the first 4 vibrational levels of the ion.
![]() Research and Text by: Rachel Niemer (1999)
Research and Text by: Rachel Niemer (1999)
This document was created by
Jonathan M. Smith,
Chemistry Department, Gustavus Adolphus College, 1999
Last maintained: September 6, 1999